Why database monitoring matters: Protecting your data's lifeline
![]() Monitoring Fujitsu Enterprise Postgres is crucial for maintaining database performance, detecting anomalies, and availability. Prometheus is a feature rich open-source monitoring and alerting tool, which collects and stores time-series data. Prometheus employs a pull-based model, effective query language (PromQL), and plenty of exporters that make it a perfect choice for monitoring complex systems like Fujitsu Enterprise Postgres.
Monitoring Fujitsu Enterprise Postgres is crucial for maintaining database performance, detecting anomalies, and availability. Prometheus is a feature rich open-source monitoring and alerting tool, which collects and stores time-series data. Prometheus employs a pull-based model, effective query language (PromQL), and plenty of exporters that make it a perfect choice for monitoring complex systems like Fujitsu Enterprise Postgres.
This article will guide you through configuring Prometheus to monitor your Fujitsu Enterprise Postgres clusters.
Prerequisites
- Fujitsu Enterprise Postgres installed and running
- Server available to install Prometheus and Grafana
Below is the basic architecture of monitoring Fujitsu Enterprise Postgres with Prometheus and Grafana.

Configure Postgres Exporter
The first step to monitor Fujitsu Enterprise Postgres clusters with Prometheus is to install the Postgres Exporter on the database server. The Postgres Exporter queries the database and exposes the metrics on an endpoint that Prometheus can scrape from.
Download Postgres Exporter
Find and download the latest release of the postgres_exporter from the official Prometheus GitHub repository:
As per the GitHub page, the recent postgres_exporter is tested on all PostgreSQL versions starting with version 11 onwards.
# On Database host: 10.1.0.14
$ sudo -i
$ cd /tmp/
$ curl -LO https://github.com/prometheus-community/postgres_exporter/releases/download/v0.17.1/postgres_exporter-0.17.1.linux-amd64.tar.gz
Add database connection
Once the Postgres Exporter zip file has been downloaded, extract the executable files and prepare the environment file.
Create a database user, to connect and query the statistics tables.
CREATE ROLE prometheus WITH LOGIN PASSWORD 'Secret123';
GRANT pg_monitor TO prometheus;
Add the below entry to pg_hba.conf file to allow connection from the user prometheus.
# TYPE  DATABASE      USER        ADDRESS    METHOD
host    all           prometheus  samehost   scram-sha-256

$ pg_ctl -D $PGDATA reload
Now uncompress the zip file and copy the executable files as below. Also prepare the environment file to connect to the database.
$ tar -xvf postgres_exporter-0.17.1.linux-amd64.tar.gz
$ mv postgres_exporter-0.17.1.linux-amd64 /opt/postgres_exporter
$ cd /opt/postgres_exporter/
$ cp /opt/postgres_exporter/postgres_exporter /usr/local/bin/
$ cat fep_exporter.env
# To monitor all databases in the Fujitsu Enterprise Postgres cluster
DATA_SOURCE_NAME="postgresql://prometheus:Secret123@10.1.0.14:27517/postgres?sslmode=disable"
Create systemd service file
Now create a service file for starting the exporter service. In this example, I start the system service as root user, but you can choose to have a dedicated user for running postgres_exporter. The desired port number for the exporter can be specified in the service file.
cat /etc/systemd/system/fep17_exporter.service
[Unit]
Description=Prometheus exporter for Fujitsu Enterprise Postgres
Wants=network-online.target
After=network-online.target

[Service]
User=fepuser
Group=fepuser
WorkingDirectory=/opt/postgres_exporter
EnvironmentFile=/opt/postgres_exporter/fep_exporter.env
ExecStart=/usr/local/bin/postgres_exporter --web.listen-address=:9187 --web.telemetry-path=/metrics
Restart=always

[Install]
WantedBy=multi-user.target
Start the service, once the service file is ready.
systemctl daemon-reload
systemctl enable --now fep17_exporter
systemctl status fep17_exporter
Verify the collected Fujitsu Enterprise Postgres metrics through the web URL:
curl http://localhost:9187/metrics
curl http://10.1.0.14:9187/metrics
To allow the Prometheus server running on a different host to access the Postgres Exporter endpoint, add the port to the firewall:
sudo firewall-cmd –state
sudo firewall-cmd --add-port=9187/tcp --permanent
sudo firewall-cmd --reload
Configure Prometheus
Prometheus collects and stores time-series data from the exporter service. It also offers a query language called PromQL to query the collected data. Next, install Prometheus to scrape the metrics exposed by Postgres exporter on the database server.
Download Prometheus
Find and download the latest release of Prometheus software from the official GitHub repository.
As the Prometheus server can be configured to monitor multiple database servers or applications, we are installing it on a separate server.
Create user and group:
Create a OS user account and group named ‘gap’, which will be used by monitoring stack, i.e., Prometheus, AlertManager and Grafana.
# On Prometheus server: 10.1.0.35
$ sudo groupadd --system gap
$ sudo useradd -s /sbin/nologin --system -g gap gap
Download and configure Prometheus:
$ cd /tmp
$ curl -LO  https://github.com/prometheus/prometheus/releases/download/v3.2.1/prometheus-3.2.1.linux-amd64.tar.gz

$ tar -xvf prometheus-3.2.1.linux-amd64.tar.gz
$ cd /tmp/prometheus-3.2.1.linux-amd64/
$ cp prometheus promtool /usr/local/bin/
$ mkdir -p /var/lib/prometheus/ /etc/prometheus/
$ cp prometheus.yml /etc/prometheus/
$ sudo chown gap:gap -R /etc/prometheus /var/lib/prometheus/
$ ls -ld /etc/prometheus/ /var/lib/prometheus/
Configure Prometheus to scrape Fujitsu Enterprise Postgres metrics
Edit the Prometheus configuration file located at /etc/prometheus/prometheus.yml and update the section scrape_configs as below,:
scrape_configs:
  # The job name is added as a label `job=<job_name>` to any timeseries scraped from this config.
- job_name: 'fep17_exporter'
    scrape_interval: 5s
    static_configs:
      - targets: ["10.1.0.14:9187"]
- job_name: 'fep16_exporter'
    scrape_interval: 5s
    static_configs:
      - targets: ["10.1.0.79:9187"]

# metrics_path defaults to '/metrics'
    # scheme defaults to 'http'.
In the above, I’ve added two targets to Prometheus to scrape the metrics. You can add multiple database targets to the Prometheus server.
Create systemd service for Prometheus
Prepare the service file for Prometheus, to start/stop the service.
cat /etc/systemd/system/prometheus.service
[Unit]
Description=Prometheus monitoring
Wants=network-online.target
After=network-online.target

[Service]
Type=simple
User=gap
Group=gap
ExecStart=/usr/local/bin/prometheus \
--config.file=/etc/prometheus/prometheus.yml \
--storage.tsdb.path=/var/lib/prometheus \
--web.listen-address=:9090
SyslogIdentifier=prometheus
Restart=always

[Install]
WantedBy=multi-user.target
Once the service file is ready, you can start the Prometheus service and enable it, so that it can automatically start after server reboot.
systemctl daemon-reload
systemctl enable --now prometheus
systemctl status prometheus
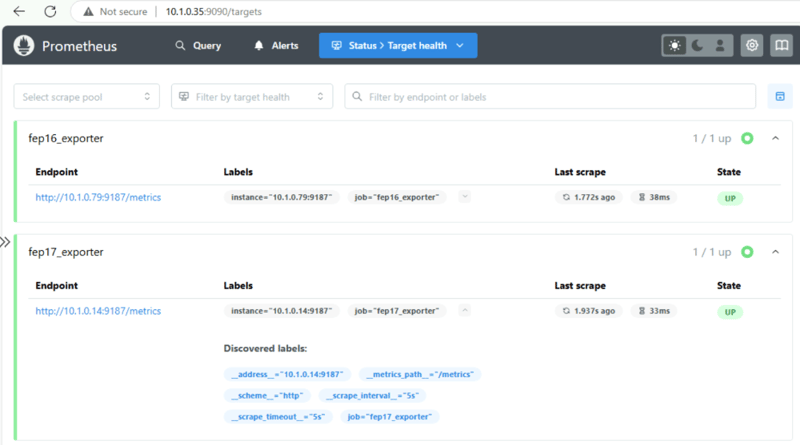
 Verify the monitored targets and configuration through the web URLs.
- http://10.1.0.35:9090/targets
- http://10.1.0.35:9090/config
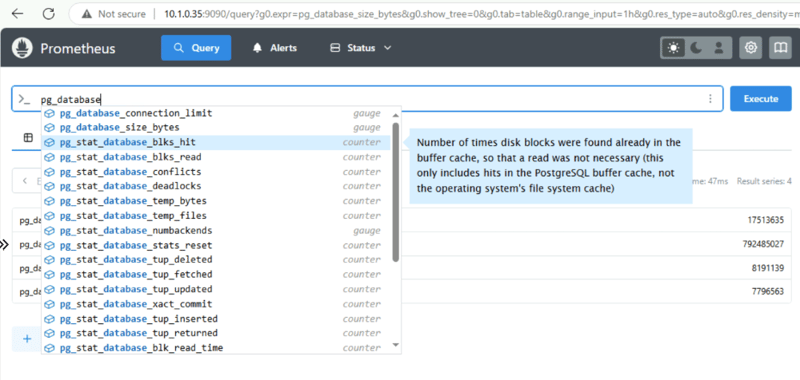
 Make sure you can query the collected metrics from query page
- http://10.1.0.35:9090/query
 The Prometheus server can be secured using SSL/TLS certificates and basic authentication. TLS certificates provide secure communication between the server and scrape endpoints using HTTPS protocol
To secure the Prometheus server using basic authentication, refer to:
The Prometheus server can be secured using SSL/TLS certificates and basic authentication. TLS certificates provide secure communication between the server and scrape endpoints using HTTPS protocol
To secure the Prometheus server using basic authentication, refer to:
The configuration for TLS and basic authentication can be passed to the server using the flag --web.config.file=<filename>.
Grafana Dashboard
Grafana is a powerful open-source visualization tool, which takes time-series data stored in Prometheus and allows to create insightful dashboards. It also allows to query the data and configure alerts.
Now let us see how we can install Grafana on a Linux server.
Install Grafana
To install Grafana, add a yum repository for Grafana, as below:
For details on how to install Grafana, refer to:
$ cat /etc/yum.repos.d/grafana.repo
[grafana]
name=grafana
baseurl=https://rpm.grafana.com
repo_gpgcheck=1
enabled=1
gpgcheck=1
gpgkey=https://rpm.grafana.com/gpg.key
sslverify=1
sslcacert=/etc/pki/tls/certs/ca-bundle.crt
Once the yum repository is configured, install the Grafana server.
$ sudo dnf install grafana --repo=grafana
Create systemd service for Grafana
The Grafana installation copies the system service file to the below location.
ls /usr/lib/systemd/system/grafana-server.service
As we planned to use a common user –gap– for Prometheus and Grafana, update the server file with User and Group to gap.
Also change ownership of the directories and start the Grafana service.
chown gap:gap -R /etc/grafana/ /var/lib/grafana/
systemctl daemon-reload
systemctl enable --now grafana-server
systemctl status grafana-server
As the Grafana server is up, you can access Grafana using the URL below.
http://10.1.0.35:3000/When you log in for the first time, type admin in username and password, and you will be prompted to change the password.
Configure Prometheus as data source
Log in to the Grafana UI, go to Data Sources and add data source and choose Prometheus.
http://10.1.0.35:3000/connections/datasourcesOn the next page, update the Prometheus server URL to http://10.1.0.35:9090, then click Save & Test to verify the connection.
Import dashboards
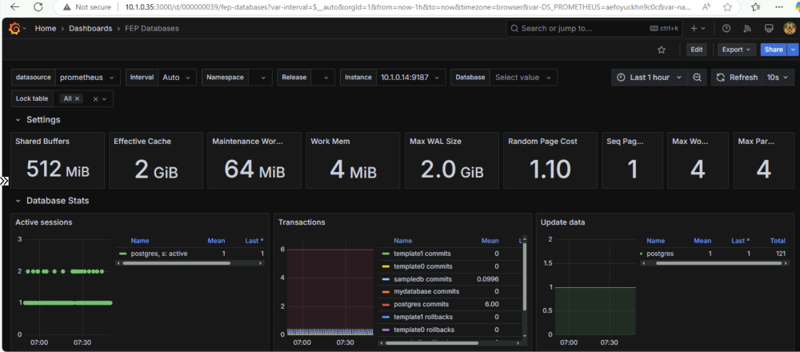
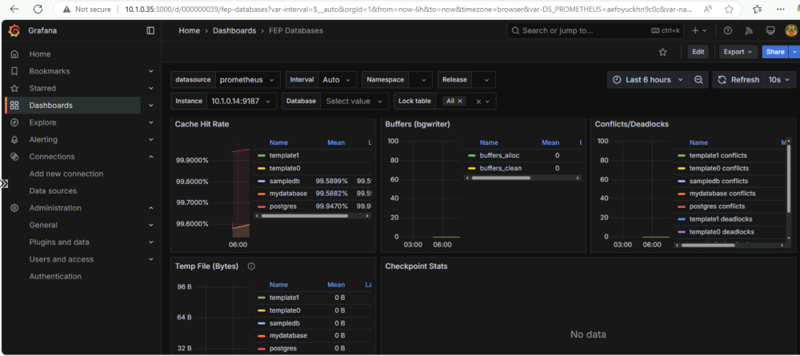
Now you can either create your own dashboard or import it from Grafana’s dashboard repository.
Grafana Alerting
Alerting can be configured either from Grafana UI or Prometheus AlertManager. In this article, we explore the alerting from Grafana.
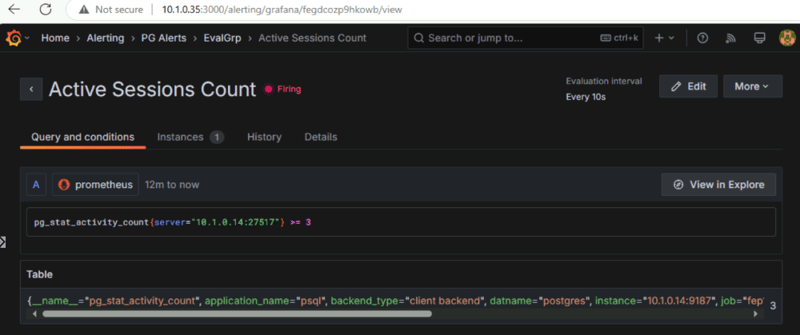
Grafana allows to configure alerting for almost all the parameters that are being monitored. You can create alert rules in Grafana and define threshold based on your requirements for alerting. It periodically evaluates alert rules and trigger alerts. If a threshold set for alert rule is breached, then it can trigger notifications for firing and send notifications to email, slack, etc.
In the below image, you can see that two alerts are configured (Instance Status and Active Sessions Count) and sessions count is in Firing state as it reached the threshold.
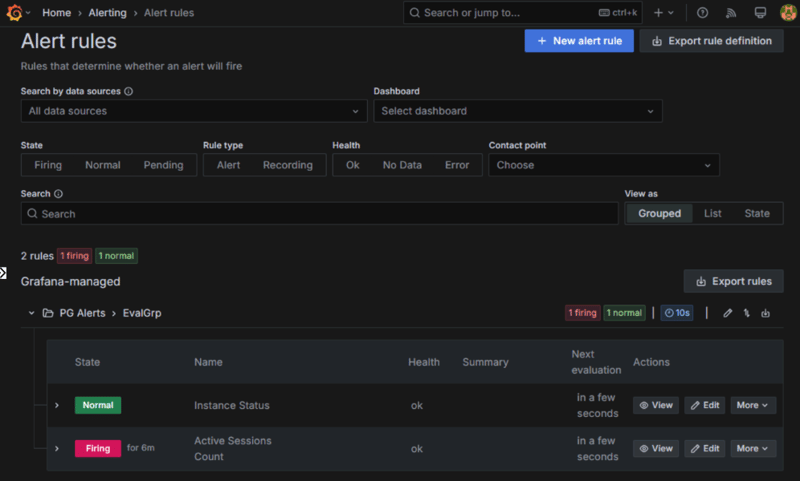
When you click the View icon next to the Firing alert, you can see the query and the condition defined for the alert.