


In the PostgreSQL community, logical replication has been one of the hottest topics where many developers have contributed to various improvements since its first release in PostgreSQL 10.
Along with this history of logical replication, pg_stat_replication_slots has been built to monitor statistics associated with internal resource usages of logical decoding, and this is what I will discuss in this blog post.
Before we start
You must be excited to utilize the new view already. However, for some users, it may be confusing to distinguish the number of transactions from the counts incremented by streaming or spilling data to disk. You can see the definition of all the columns in pg_stat_replication_slots view here![]() .
.
First of all, let’s start with a bird’s-eye view of logical replication and logical_decoding_work_mem![]() , which is a GUC parameter inseparable from this topic. The information provided here will allow readers to grasp the basic flow of some of the internal processing, which will be helpful to the users of logical decoding and logical replication features or if you’re interested in and is new to the review activities of those features
, which is a GUC parameter inseparable from this topic. The information provided here will allow readers to grasp the basic flow of some of the internal processing, which will be helpful to the users of logical decoding and logical replication features or if you’re interested in and is new to the review activities of those features
How pg_stat_replication_slots works in the whole system
As you know, in a logical replication setup, we have two roles: publisher and subscriber. On the publisher side, the walsender process extracts WAL one by one and transforms the WAL changes to the logical replication protocol with pgoutput. Then, the data which corresponds to the publication specification is transferred continuously to the apply worker on the subscriber side.
Each subscription receives data from a logical replication slot on the remote publishing side. A logical replication slot is the mechanism that represents a stream of changes that can be replayed to the client in the order they were made on the original server, while preventing the removal of WAL needed for decoding purposes. One statistics record (row) of pg_stat_replication_slots is created for each logical replication slot described above. Only one receiver may consume changes from a slot at any given time, although it’s possible to have different receivers using the same slot at different times. The statistics of the slot can be used for either another decoding output plugin or for the subscriber. In this article, we will use logical replication for the examples.
Logical decoding and its memory size
 During the WAL reading phase of walsender, the process expands the WAL content in memory in a structure called ReorderBufferChange, which represents each type of change for logical decoding. Note that this data structure is more than a simple representation of WAL, and it can hold internal information that users of logical decoding don’t have to be aware of, such as an addition of a new snapshot accompanied by catalog modification.
The transaction data usage per decoding is calculated as the total of the structure size and the extra important information expanded for the change. For example, the transaction data consumption of decoding INSERT is the total of ReorderBufferChange as the base data size, HeapTupleData structure size, and the length of the new tuple. Similarly, when decoding TRUNCATE, it is the total of the base data size and the size of OID multiplied by the number of relations to be truncated.
In this way, the transaction memory usage for the view statistics is calculated depending on what kind of operation has been done in the change. To sort the changes of each transaction, the walsender process holds a hash table whose key is xid and the values are the transaction changes. Obviously, the more changes we have in a transaction, the larger the accumulated memory consumption for the transaction.
logical_decoding_work_mem mechanism
Next, we will cover the mechanism of logical_decoding_work_mem. The community has introduced a limit of memory for the decoding processing, to keep the server from running out of memory with large transactions and/or many sessions.
This parameter allows users to specify the maximum amount of memory to be used by logical decoding before the system decides to either write the decoded changes to local disk (disk spilling) or stream them to the subscriber. This check is run for each decoding, as mentioned above. When transaction memory exceeds the threshold, disk spilling or streaming of the in-progress transaction is triggered depending on the configuration streaming = on/off specified for the subscription.
Observing disk spilling with pg_stat_replication_slots
A simple case of spill is explained below. In the logical replication setup of PostgreSQL 14, prepare one table named tab with an integer column, and set streaming = off.
- Insert 3,000 rows of data, exceeding the logical_decoding_work_mem set to 64kB.
- Check the statistics update of spill-related columns.
-[ RECORD 1 ]-------
slot_name | mysub
spill_txns | 1
spill_count | 7
spill_bytes | 396000
Decoded data spills to disk whenever the transaction memory reaches the value set for logical_decoding_work_mem. Additionally, as a part of the processing to decode commit records, there is a mechanism to also spill the last remaining transaction data to disk, even when its size is below the threshold.

In the above example, the number of transactions inserting 3,000 rows is just 1, as shown in the spill_txns column. The total size of the decoded data is 396,000 bytes. The total number of walsender’s spill is 7, resulting from the 6 times that the logical_decoding_work_mem threshold has been reached plus 1 time for the last remaining changes.
The important point to note here is that when writing the data of a transaction, the entire size of the target transaction spills to disk if the threshold is exceeded even once. The number of times disk spilling occurs depends on the value set for logical_decoding_work_mem.
Observing streaming of in-progress transactions with pg_stat_replication_slots
In this section, I'll explain another behavior with a more interesting scenario. The fundamental mechanism to check the memory size for each decoding processing is basically the same as that described for disk spilling.
Here, to grasp the flow including the concept of selecting transactions, we’ll use 3 sizes of insertions (relatively large – 300 records, medium – 200 records, and small – 10 records in this context) and execute those one by one in 2 sessions in a logical replication setup, while observing walsender's update of the statistics values. A publication is created for the tab table, and a subscription is created for the publication like in the first spill example.
The large and medium size insertions, executed sequentially, do not cause the system to reach logical_decoding_work_mem set to 64kB. However, running them in parallel triggers our trick to emulate streaming of an in-progress transaction scenario. The subscription this time is created with streaming = on.
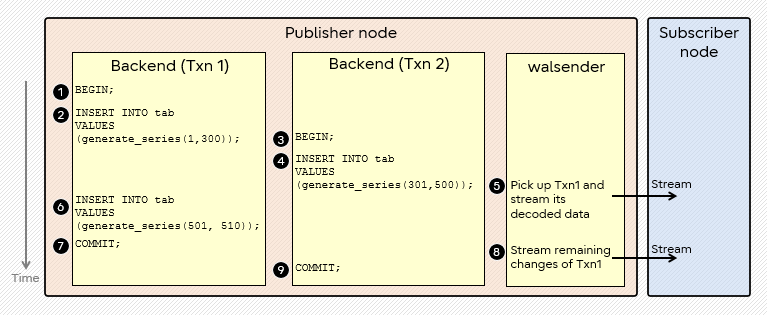
In the figure above, Txn1 starts a transaction first and inserts the relatively large-sized data. Next, another session, Txn2, starts and inserts the middle-sized data in parallel. WAL records are written by each backend. Meanwhile, the walsender process decodes WAL. walsender extracts the changes and when the memory threshold is reached, it picks up the transaction to stream.
Strictly speaking, 5 can be triggered around the end of 4 in this case, since the walsender works somehow independently. The timing of end of 5 can change slightly, earlier or later, but we’ll proceed after checking the update of statistics values in this example.
Note that the walsender process chooses Txn1 as the largest transaction, not Txn2 in this case, although executing 4 in Txn2 in parallel caused the memory threshold to be exceeded. Thus, the 300 records of insertions are streamed to the subscriber at the beginning. Like disk spilling, once streaming of an in-progress transaction is triggered for the transaction, the entire transaction is processed in the same way.
Although this is not described above, Txn2 data is sent to the subscriber in one go after the commit.
Below, we will take a look at the statistics update of streaming-related columns of pg_stat_replication_slots which were taken at five separate timings during this emulation.
- At first, between 2 and 3, there is no streaming transaction count.
-[ RECORD 1 ]+------
stream_txns | 0
stream_count | 0
stream_bytes | 0
- Between 5 and 6, just after streaming of the first part of Txn1 is completed.
-[ RECORD 1 ]+------
stream_txns | 1
stream_count | 1
stream_bytes | 39600
- Between 6 and 7, after the additional insertion started but before commit.
-[ RECORD 1 ]+------
stream_txns | 1
stream_count | 1
stream_bytes | 39600
- Between 8 and 9, when the streaming of the remaining part of Txn1 is completed.
-[ RECORD 1 ]+------
stream_txns | 1
stream_count | 2
stream_bytes | 40920
- After 9 (commit of Txn2), we can see that Txn2 was not processed by streaming.
-[ RECORD 1 ]+------
stream_txns | 1
stream_count | 2
stream_bytes | 40920
Note that there are exceptions in the process to pick up the largest (top) transactions. For example, streaming of transactions which decoded speculative insert![]() is postponed until the walsender process receives the decoding of speculative confirm or abort. See the exceptions of streaming cases in the documentation
is postponed until the walsender process receives the decoding of speculative confirm or abort. See the exceptions of streaming cases in the documentation![]() .
.
To enrich your understanding a little bit more, let’s have a brief look at the message flow on the subscriber side in the figure below to see how the previous case is applied.
It is important to be aware that there is a mechanism in which the subscriber spools the data streamed for in-progress transactions, and commits or aborts the content according to the following message. For simplicity, I folded the same sequential logical replication messages for INSERT without presenting the actual record values in the figure. The value indicated after INSERT is the number of folded records.
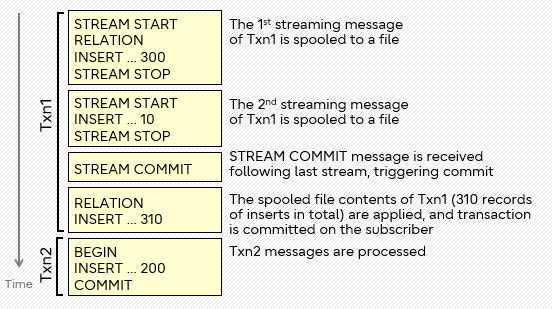
To make the explanation simpler, I grouped multiple logical replication messages above inside yellow rectangles, according to the stages of the processing. As you can see, the first 2 streamed messages for Txn1 are seen between STREAM START and STREAM STOP messages. Each streaming block corresponds to the two flows of streamed data depicted in the first figure. Remember, the streamed data for the small-sized insertion of 10 records is sent at the commit of Txn1. Therefore, STREAM COMMIT is sent just after the second streaming block. STREAM COMMIT is the trigger to process the spooled contents and commit the transaction. Then, Txn2 is also sent to the subscriber but not streamed before its commit.
In pg_stat_replication_slots, there are columns for all types of transactions. Those columns represent and record all transaction resource activities, including both spilled and streamed transactions. Txn2 is not streamed before the commit (nor spilt), but the statistics for it are also stored in the columns.
Conclusion
In this blog post I described how we can observe and understand the internal decoding activities by referencing the pg_stat_replication_slots view.
 Key takeaways:
- The walsender process manages the size of the amount of decoded data.
- Transactions that don’t exceed logical_decoding_work_mem won’t get handled by spilling nor streaming before the commit.
- For both disk spilling and streaming of in-progress transactions, excluding a few exceptions, the method is applied for the entire transaction once it is triggered.
By utilizing the pg_stat_replication_slots view, users can understand how much resource is used and how many events take place to handle transactions that exceeded the memory threshold.
In the real world, transactions issued by business systems running in production are by far more complex than the examples I’ve shown. However, what I explained here is the basis for understanding more advanced cases.
For the future
Last but not least, I would like to express my gratitude for all the work the community has put into this feature. Although pg_stat_replication_slots itself was introduced in PostgreSQL 14, the numerous commits behind the scenes to build the view tell us the dedication of the community to implement it.
Currently, there are discussions in progress to enhance the subscriber-side statistics in the community. I’m looking forward to those suggested improvements being committed and becoming available to users who will be able to enjoy the benefits.
If you would like to learn more
If you are interested in logical decoding and would like to learn how PostgreSQL performs it for two-phase commits, my colleague Ajin Cherian wrote a blog post on Logical decoding of two-phase commits in PostgreSQL 14.

