This article provides practical knowledge about database system monitoring, with practical examples on relevant commands, functions, and views.
Four types of monitoring are discussed: life check monitoring and status monitoring, message monitoring, capacity monitoring, and performance monitoring.
Life check and status monitoring
OS commands and PostgreSQL commands used in life check monitoring and status monitoring for the server and PostgreSQL are shown below.
| Type |
Metrics |
Commands/functions |
| OS |
PostgreSQL |
Life check
monitoring |
Server OS response |
ping |
- |
| PostgreSQL process status |
ps |
pg_isready |
| SQL execution |
- |
Execute simple SQL such as "SELECT 1". |
Status
monitoring |
CPU usage |
sar
vmstat
mpstat |
- |
| Memory usage |
free
vmstat |
- |
| I/O busy rate |
sar
iostat |
- |
| Network bandwidth usage |
sar |
- |
Next, we will look at how to execute these commands. The options used with each command are examples only. There are other useful options as well that can be used together, so consider what kind of options you need according to your monitoring policy. Use the return value of the command when checking with the shell script.
Server OS response
ping command
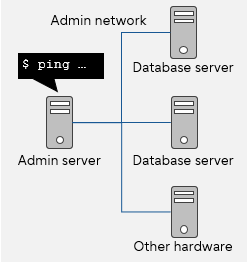
Use the ping command to test is a server is reachable. Use the -c option to specify the number of ping requests to attempts - for example, ping -c 1 will try to reach the server only once. To avoid false negatives caused by temporary network disconnections, make a few retries if the ping fails.
If the server is running, you will see the line 1 packets transmitted, 1 received, indicating that there was a response. The command returns 0 if it executed successfully, or another value if a problem occurred, such as no response was received.
Execute ping from another server such as the admin server.
$ ping -c 1 192.0.2.1
PING 192.0.2.1 (192.0.2.1) 56(84) bytes of data.
64 bytes from 192.0.2.1: icmp_seq=1 ttl=57 time=1.56 ms
--- 192.0.2.1 ping statistics ---
1 packets transmitted, 1 received, 0% packet loss, time 1ms
rtt min/avg/max/mdev = 1.569/1.569/1.569/0.000 ms
$ echo $?
0
PostgreSQL process life check
Execute the operating system's ps command on the PostgreSQL database server to confirm that the specified PostgreSQL process is running. For PostgreSQL, monitoring the master process (postmaster) is recommended - there is no need to monitor Postgres child processes. One or more master processes may be temporarily running , so it is normal to see more than one master process listed.
$ ps auxww | grep /bin/postgres
postgres 3297 0.0 0.0 107464 920 pts/1 S+ 15:15 0:00 grep /bin/postgres
postgres 17099 0.0 0.0 264536 1828 ? S October07 0:07 /usr/local/pgsql/bin/postgres
You can also use PostgreSQL's utility pg_isready for life check monitoring. This is a simple command that checks the connection status of a PostgreSQL server, which allows us to know if PostgreSQL processes are running.
The return values are 0 if the server is accepting connections normally, 1 if the server is rejecting connections, 2 if there is no response to the connection attempt, or 3 if no attempt was made (due to invalid parameters, for example).
pg_isready can also be executed from a PostgreSQL client (separate machine).
$ pg_isready -h 192.0.2.1
192.0.2.1:5432 -accepting connections
$ echo $?
0
SQL execution check
Execute a simple SQL statement to check if SQL can be executed normally. For example, execute SELECT 1 with psql –c and check that the result is as expected.
The command returns 0 if successful, or another value otherwise.
psql can also be executed from a PostgreSQL client (separate machine).
$ psql -c "SELECT 1" postgres
?column?
----------
1
(1 row)
$echo $?
0
CPU usage
Use the operating system's sar command on the PostgreSQL database server to check the CPU usage rate. The -u option shows cumulative usage of all CPUs, and -P ALL shows CPU usage of individual cores.
In the example below, using sar -u 1 60 will get you data 60 times every 1 second. You can check the CPU usage rate by referring to %user (CPU usage running applications at the user level), %nice (CPU usage running applications at the user level with nice priority), and %system (CPU usage running process at the system level).
If %user is increasing, it is possible that a specific application is consuming CPU, so check which application it is by using a command such as ps.
$ sar -u 1 60
Linux 3.10.0-693.11.6.el7.x86_64 (VM123456.localdomain) 2023-10-03 _x86_64_ (2 CPU)
06:01:52pm CPU %user %nice %system %iowait %steal %idle
06:01:53pm all 0.50 0.00 0.50 0.00 0.00 99.00
06:01:54pm all 0.00 0.00 0.50 0.00 0.00 99.50
06:01:55pm all 0.00 0.00 0.00 0.00 0.00 100.00
06:01:56pm all 0.00 0.00 0.50 0.00 0.00 99.50
06:01:57pm all 1.01 0.00 1.01 0.00 0.00 97.99
Memory usage
Use the operating system's free command on the PostgreSQL database server to check the memory usage rate. The -m option displays the values in MB, which is useful since it may be harder to read when displayed in bytes, and the -t option displays the total of physical memory and swap memory.
To calculate memory usage, use the values in columns total (total capacity) and available (memory estimated to be available without swapping).
memory usage = (total - available) ÷ total × 100
$ free -m -t
total used free shared buff/cache available A
Mem: 3782 848 926 390 2007 2205
Swap: 3967 373 3594
Total: 7750 1222 4520
A available is an item added from Red Hat® Enterprise Linux® 7.
I/O busy rate
Use the operating system's iostat command on the PostgreSQL database server to check I/O data for each disk. By default, CPU statistics and disk statistics are displayed. To display more detailed statistical data, specify the -x option.
- avgrq-sz - Average request size
- avgqu-sz - Average request queue length
- await - Average request wait time (in ms)
- %util - Device bandwith usage
$ iostat -xkdt
Linux 3.10.0-693.11.6.el7.x86_64 (VM123456.localdomain) 2020-10-03 _x86_64_ (2 CPU)
2020-10-03 01:24:32PM
Device: rrqm/s wrqm/s r/s w/s rKB/s wKB/s avgrq-sz avgqu-sz await r_await w_await svctm %util
sda 0.00 0.03 0.05 1.32 3.13 37.85 59.83 0.01 3.71 8.79 3.51 0.73 0.10
dm-0 0.00 0.00 0.05 1.34 3.11 37.79 58.99 0.01 3.70 8.86 3.51 0.72 0.10
dm-1 0.00 0.00 0.00 0.01 0.01 0.05 8.02 0.00 24.45 6.33 29.17 0.35 0.00
Network bandwidth usage
To check network bandwidth, use the operating system's sar command with the -n DEV option on the PostgreSQL database server.
The transmission line usage status can be checked in the following columns.
- rxpck/s - Number of packets received in 1 second
- txpck/s - Number of packets sent in 1 second
- rxkB/s - KB of packets received in 1 second
- txkB/s - KB of packets sent in 1 second
$ sar -n DEV
Linux 3.10.0-693.11.6.el7.x86_64 (VM123456.localdomain) 2020-10-03 _x86_64_ (2 CPU)
00:00:01am IFACE rxpck/s txpck/s rxkB/s txkB/s rxcmp/s txcmp/s rxmcst/s
00:10:02am ens192 0.40 0.17 0.09 0.01 0.00 0.00 0.01
00:10:02am lo 5.16 5.16 1.40 1.40 0.00 0.00 0.00
00:20:01am ens192 171.41 110.91 225.16 7.20 0.00 0.00 0.00
00:20:01am lo 2.75 2.75 1.00 1.00 0.00 0.00 0.00
00:30:01am ens192 0.22 0.00 0.03 0.00 0.00 0.00 0.00
00:30:01am lo 2.80 2.80 1.04 1.04 0.00 0.00 0.00
:
:
Message monitoring
PostgreSQL outputs messages to the server log. Analyse the cause of an error from these messages and take appropriate actions.
Monitoring item
Each message has a severity level to indicate the seriousness of the problem. We recommend attending to messages with PANIC, FATAL, and ERROR levels with priority, as they may affect the stable operation of your database. Messages with LOG level also need to be monitored for performance monitoring.
The log output destination can be changed to syslog by a setting in postgresql.conf, in which case the message level is converted to the levels listed under the syslog column below.
| Severity level |
Indication |
syslog |
| PANIC |
Information about an error that caused all database sessions to be interrupted |
CRIT |
| FATAL |
Information about an error that caused the current session to be interrupted |
ERR |
| ERROR |
Information about an error that caused the current command to be interrupted |
WARNING |
| LOG |
Information that administrators needs to know, such as checkpoint activities |
INFO |
| WARNING |
Warning information for users, like COMMIT outside the transaction block |
NOTICE |
| NOTICE |
Information to help the user, such as notes about truncating long identifiers |
NOTICE |
| INFO |
Information implicitly requested by the user, such as the output of VACUUM VERBOSE |
INFO |
DEBUG1 to
DEBUG5 |
Continuous, detailed information used by developers |
DEBUG |
Below are example messages.
Example 1
Connection refused (message for connection from outside pg_hba.conf)
2023-10-03 10:29:05.873 [4043]: … FATAL: no pg_hba.conf entry for host "198.51.100.1", user "admin", database "postgres", SSL off
Example 2
Connection violating a rule (no table access privilege)
2023-10-03 10:31:22.313 [4139]: … ERROR: The access to table "sales" was denied.
Key point
If an error occurs, logged messages will help you identify and analyze the cause. In addition to error messages, PostgreSQL also outputs error location and hints to the log. Use these to analyze and investigate the error.
| Category |
Content |
| STATEMENT |
The actual process that caused the error |
| LOCATION |
The position in the code where the error occurred |
| HINT |
Cause and workaround of the error that occurred |
| CONTEXT |
Context in which the error occurred (functions, etc.) |
Log output settings
In order to monitor messages, configure the settings so that messages are output to the log file. The main postgresql.conf parameters required for message monitoring are below.
Where to output logs
- log_destination - Log output destination
- logging_collector - Whether to save the contents of log messages to a file
- log_directory - Directory for storing log files
- log_filename - Log file name
When to collect logs
- log_min_messages - Severity levels for messages to be written to the server log
- log_min_error_statement -Severity levels for SQL statements that caused the error to be recorded in the server log
- log_min_duration_statement - Standard time to complete an SQL statement. The duration of completed SQL statements will be recorded in the server log if the statement ran longer than this specified time
What to output to the log
- log_checkpoints - Whether to output information about checkpoints and restart points
- log_connections - Whether to output information related to connections to the server
- log_disconnections - Whether to output information related to server disconnections
- log_lock_waits - Whether to output information when it is taking a certain period of time to acquire a lock
Capacity monitoring
It is essential to perform capacity monitoring for database cluster areas (directories specified by the environment variable PGDATA), TABLESPACE areas, and areas for storing archived transaction logs (WAL: Write-Ahead Log). Insufficient capacity of these areas can lead to the issues below:
- Cannot update data
- Cannot create new databases or tables
- Forced termination when WAL disk space is insufficient
- Data or WAL may be corrupted
To avoid these issues, monitor disk usage and free space, and take the following actions before running out of space:
- Delete unnecessary files
- Distribute databases and tables to multiple disks using tablespaces
- Use REINDEX to rebuild indexes if index bloat occurs
- Delete unnecessary archive logs by performing backup
- Add new disks and move data
By monitoring the capacity, you can take preventative measures such as adding more disks before running out of space. For example, by coordinating with other tools, you can configure the system to raise an alert when free disk space falls below 20%. Remember to set this threshold to a value that allows sufficient time to handle it.
The following are the files in PostgreSQL that should be monitored.
| Monitored data |
Target directory |
Commands/functions |
| OS |
PostgreSQL |
|
Tables
Indexes
|
$PGDATA/base |
du
ls |
pg_database_size
pg_total_relation_size
pg_table_size
pg_indexes_size |
| Directory specified for tablespace (TABLESPACE) |
pg_tablespace_size |
| Temporary areas for disk sort, hash processing, etc. |
$PGDATA/base/pgsql_tmp |
- |
| Server log |
$PGDATA/log*1 |
| syslog |
/var/log*2 |
| WAL |
$PGDATA/pg_wal |
| WAL archive |
Directory specified for WAL archive |
*1: Can be changed via log_directory in postgresql.conf
*2: Can be changed in /etc/syslog.conf or /etc/rsyslog.conf
Key points during operation
Pay attention to free disk space when executing particular SQL commands, including below.
- VACCUM
Monitor $PGDATA/pg_wal, since a large amount of WAL is output during this operation.
- REINDEX or ALTER TABLE
Monitor $PGDATA/base, because it impacts the directory that contains the target table or index.
Also monitor $PGDATA/pg_wal, since a large amount of WAL is also output during this operation.
Now, we will look at examples using the du command and the pg_database_size function.
du command
Use the operating system's du command to check disk usage. Specify the -L option to follow all symbolic links, and either the -k or -m option, to show the size in KB or MB, respectively. The example below displays the disk usage under $PGDATA in MB.
$ du -L -m $PGDATA
:
32 ./$PGDATA/pg_wal A
:
8 ./$PGDATA/base/1 B
8 ./$PGDATA/base/13968
8 ./$PGDATA/base/13969
23 ./$PGDATA/base/16384
0 ./$PGDATA/base/pgsql_tmp C
47 ./$PGDATA/base
:
1 ./$PGDATA/log D
80 ./$PGDATA
A WAL
B Tables or indexes when subfolders in 'base' are named with digits
C Temporary area for disk sort, hash processing, etc.
D Server log
pg_database_size function
Use PostgreSQL's pg_database_size function to check disk space used by the database. The disk capacity used by the database is acquired from the system catalog pg_database, which stores database information.
postgres=# SELECT datid,datname FROM pg_stat_database;
datid | datname
--------+-----------
13969 | postgres
16384 | testdb
1 | template1
13968 | template0
(4 rows)
Reference
When using the du command to check disk capacity used by databases, check the oid of the databases in advance to identify the target database.
In the example output above, we can see that the oid of testdb is 16384. Looking at the result of the du command listed before that, the disk usage of ./$PGDATA/base/16384 is 23, which matches the result 23 MB of pg_database_size below.
postgres=# SELECT datname, pg_size_pretty(pg_database_size(datname)) FROM pg_database;
datname | pg_size_pretty
-----------+-----------------
postgres | 8035 kB
testdb | 23 MB
template1 | 7897 KB
template0 | 7897 KB
(4 rows)
Performance monitoring
Regularly obtaining performance information will allow you to identify differences in a meaningful timeframe. The recommended frequency for this is at least once a day. For details on monitoring intervals, refer to "Overview of database system monitoring - what and how to monitor > Monitoring intervals and thresholds".
PostgreSQL's statistics view collects and accumulates various information related to operating conditions. You can monitor performance here.
| Metrics |
Type of view/catalogue |
| Slow queries |
pg_stat_statements |
| Transactions that have been pending for a long time |
pg_stat_activity |
| Queries with long lock wait time |
pg_locks
pg_stat_activity
pg_class |
| Number of simultaneous connections |
pg_stat_activity |
| Throughput (commit/rollback count) |
pg_stat_database |
| Replication delay (when replication setup is used) |
pg_stat_replication
pg_stat_wal_receiver |
| Unused space (free space created by inserting or deleting data) |
pg_stat_all_tables |
| Index dispersion (whether the order of indexes and the order of tables are the same) |
pg_stats |
Key point
When statistics views are displayed, the default display format is landscape, which wraps lines when there are a large number of columns. For an easier view, it is possible to change to the vertical display. Enable the extended table format mode with the meta command \x. To revert the display setting, execute \x again.
postgres=# \x
Extension view is on.
Here, we take a look at examples of views with pg_stat_statements, pg_stat_activity, and pg_stat_database.
pg_stat_statements view
This view is useful to investigate slow queries. Columns of note are userid (OID of the user who executed the SQL), query (text of the SQL executed), calls (number of the the SQL was executed), and total_exec_time (total time spent executing the SQL, in ms).
pg_stat_activity view
Use this view to check if there are transactions pending for a long time or to check the number of simultaneous connections. Check xact_start (transaction start time) to see if there are any transactions pending for a long time. No value is output when no transaction is being executed at that time. If any value is shown from a while ago, it means that a transaction has been pending. To check the number of simultaneous connections, check the current number of rows in the view.
postgres=# SELECT * FROM pg_stat_activity;
-[ RECORD 1 ]-----+--------------------------------
…
-[ RECORD 3 ] ----+--------------------------------
datid | 16384
datname | testdb
pid | 52101
usesysid | 10
usename | fsepyu
application_name | psql
client_addr |
client_hostname |
client_port | -1
backend_start | 2020-10-24 16:12:31.215987+09
xact_start | 2020-10-24 16:18:33.466929+09
query_start | 2020-10-24 16:18:33.466929+09
state_change | 2020-10-24 16:18:33.466934+09
wait_event_type |
wait_event |
state | active
backend_xid |
backend_xmin | 625
query | select * from pg_stat_activity;
backend_type | client backend
- [ RECORD 4 ]----+--------------------------------
…
Other important data is also provided by the pg_stat_activity view, such as backend_start (time when the process started), query_start (time when the query started), wait_event_type (status of waiting), wait_event (type of event that the backend is waiting), state (current status of backend), query (last executed query), and backend_type (type of current backend). Look at these data comprehensively for best practice.
The values displayed in state and their status are listed below.
| Value |
Status |
| active |
Query is in progress. |
| idle |
Waiting for a new client command. |
| idle in transaction |
In a transaction block, but there are no queries currently executing. |
| idle in transaction (aborted) |
Similar to idle in transaction, but there is a statement with an error in the transaction. |
| fastpath function call |
The backend is executing a fast-path function. |
| disabled |
This value is reported if the track_activities parameter is disabled in this backend. |
pg_stat_database view
This view provides, among other information, xact_commit (number of transactions committed in the database) and xact_rollback (number of transactions rolled back in the database). Throughput can be calculated by periodically acquiring xact_commit and using the formula below:
((xact_commit read this time) - (xact_commit previously read)) ÷ interval between reads
Similarly, the number of rollbacks per unit of time can also be calculated.
postgres=# SELECT * FROM pg_stat_database WHERE datname = 'testdb';
-[ RECORD 1 ]-----+--------------------
datid | 16410
datname | testdb
numbackends | 1
xact_commit | 100712
xact_rollback | 4
blks_read | 5319
blks_hit | 4789458
tup_returned | 1331468
tup_fetched | 418409
tup_inserted | 300222
tup_updated | 300068
tup_deleted | 100
conflicts | 0
temp_files | 8
temp_bytes | 4055040
deadlocks | 0
blk_read_time | 0
blk_write_time | 0
stats_reset | 2020-10-08 17:21:20.849929+09
Cache hit rate can be calculated by using blks_read (number of blocks read in this database) and blks_hit (number of times disk blocks were found already in the buffer cache, so that a read was not necessary). In memory tuning, the goal is to get this rate close to 100.
postgres=# SELECT (blks_hit * 100.0)/(blks_hit + blks_read + 1)
postgres-# FROM pg_stat_database WHERE datname = 'testdb';
-[ RECORD 1 )-----------------
?column? | 99.8509535098438171
In this article, we explained what kind of data in the database system should be monitored, focusing on metrics and types of monitoring. By monitoring from various viewpoints according to the requirements of your database system, anomalies and their signs can be detected earlier.
Knowing the status of your database system when stable, monitoring to maintain that status, and taking optimal actions against abnormal conditions are key to a highly available system.