SQL tuning involves adjusting specific SQL statements to eliminate inefficiencies or issues in the SQL process. This article provides explains what is SQL tuning, how SQL is executed, how to detect slow SQL statements, and methods to investigate the cause.
What is SQL tuning?
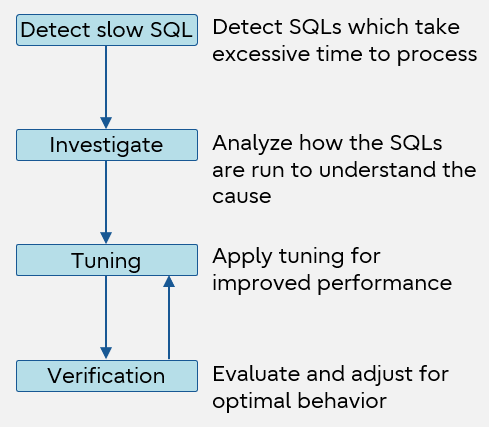
The purpose of SQL tuning is to improve the SQL performance. You analyze the internal processing of SQL and fix statements that do not meet the expected standard during SQL execution. Since the improvement is targeted to SQL statements that can have their performance improved, this work is done by testing the applications you have developed. Often you will repeat tuning and verification to ensure optimum performance.
The flow of SQL tuning is shown below.
SQL tuning process
How the SQL is executed
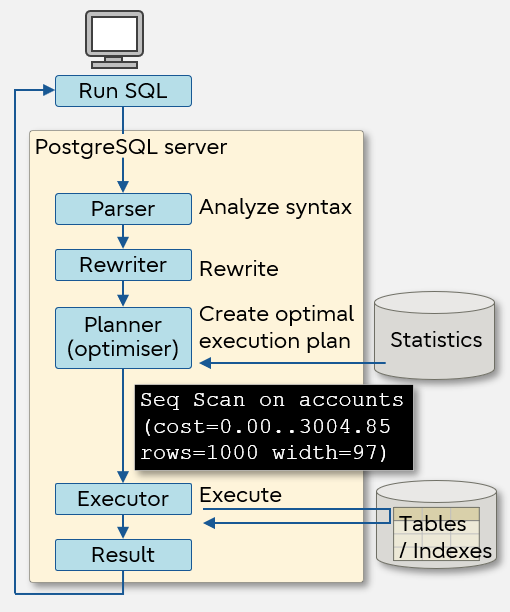
We first need to understand how the SQL is executed on the database server. We will go through the basics in this section, describing the flow from the start of the execution of a SQL statement to the return of results.
When the SQL is executed from the client, the string is parsed to check if correct syntax is used. This is performed by the parser. Next, if there is a rule (to replace SQL) defined in the database, the rewriter rewrites the statements with another SQL according to that rule. The planner (optimizer) then determines how this parsed and rewritten SQL is to be executed by referring to statistics. The statistics include summary information about how much data is stored in which table. This information and the settings in postgresql.conf are used to create an optimal SQL execution plan." The executor executes the execution plan and returns the result.
SQL execution flow
The key factor which shortens the time it takes to execute SQL and obtain the return result depends on whether a good execution plan was created from the statistics. We will discuss this topic further.
What is statistics?
PostgreSQL determines the optimal SQL execution plan (method) by referring to information such as the number of rows of tables/indexes, their size, the degree of duplication and frequency of data in each column, and the distribution status. The information for determining the optimal execution procedure (method) is called statistics, and is collected and recorded by PostgreSQL.
Gathering and refreshing statistics are done automatically during the automatic vacuum process (the autovacuum parameter in postgresql.conf is enabled by default since PostgreSQL 8.3).
Naturally, the content of the statistics will become outdated as the database is operated and data is updated. Stale statistics should not be used to determine the best way to execute SQL because the plan will likely be inadequate and inefficient to access current data. Therefore, whenever a large amount of data is loaded or updated by batch processing, use the ANALYZE command (SQL command) to refresh the statistics, instead of waiting for the automatic vacuum, since a large discrepancy between the statistics and the actual data is expected.
What is an execution plan?
PostgreSQL determines the fastest and most cost-effective method based on the statistics, choosing from multiple patterns of search/join methods and different order combination of join, to minimize the time to execute SQL from the clients. This selected method is called an execution plan.
However, the execution plan created by PostgreSQL may not necessarily be the optimal plan. As mentioned earlier, the statistics may be out of date, or it could be due to unexpected loads/behaviors of applications and lack of various resources. Therefore, SQL tuning is a very important task in building a database. We will explain how to check whether the execution plan is suitable later in this article ("How to investigate the cause").
How to detect slow SQL statements
This section describes two ways to detect a slow SQL statement. Prior settings are required to use these methods so we will guide you through how to apply the settings.
- Using the statistics view
- Using server log
How to detect slow SQL using the statistics view
The pg_stat_statements view stores runtime statistics of all SQL statements executed on the server. It stores information such as the OID (userid) of the user who executed the SQL statement, the executed SQL statement (query), the number of times the SQL statement was executed (calls), and the total time spent executing the SQL statement (total_exec_time, or total_time before PostgreSQL 13).
To use the pg_stat_statements view, it is necessary to install the additional module from a public site as follows:
CREATE EXTENSION pg_stat_statements;
Key point
Fujitsu Enterprise Postgres is shipped the module already pre-installed, so the step above is not necessary.
Also, it is necessary to add pg_stat_statements to the shared_preload_libraries parameter of postgresql.conf and set the following related parameters. After setting, restart the server and the pg_stat_statements view will be available.
| Parameter |
Description |
| shared_preload_libraries |
Specify pg_stat_statements |
| pg_stat_statements.max |
Maximum number of SQL statements that retain information |
| pg_stat_statements.track |
Specify one of the following:
- top: Records SQL statements directly executed by the client only
- all: Records everything, including those invoked within functions
- none: Do not record
|
| pg_stat_statements.track_utility |
Specify one of the following:
- on: Utility commands (i.e., all commands other than SELECT, INSERT, UPDATE, and DELETE) are also recorded
- off: Only SELECT, INSERT, UPDATE, and DELETE are recorded
|
| pg_stat_statements.save |
Specify one of the following:
- on: Retains statistics when the server ends
- off: Do not retain statistics when the server ends
|
Example
When you examine the SQL with the longest average execution time using the pg_stat_statements view, the result will look something like below.
SELECT calls,CAST(total_time AS numeric(10,3)),CAST(total_time/calls AS numeric(10,3)) AS avg_time,query
FROM pg_stat_statements ORDER BY avg_time DESC,calls LIMIT 1;
callsA | total_timeB | avg_timeC | queryD
--------+--------------+------------+---------------------------------------
1368 | 215176.360 | 157.293 | UPDATE stock SET qty = qty + ? WHERE id = ?;
3763 | 647548.710 | 172.083 | DELETE order WHERE status = ? AND total_qty < ?;
(2 rows)
ANumber of times this SQL was run
BTotal time spent to run SQL (miliseconds)
CAverage execution time = B/A
DSQL that was run
If you continue to record information about SQL statements with pg_stat_statements, performance will be affected. After tuning is completed, set pg_stat_statements.track=none (do not record) and restart the server.
How to detect using server log
If a SQL statement takes longer than the set time, the SQL statement itself and the time it took to execute it can be output to the server log as a message. By default, information about slow SQL statements is not output to the server log. To output the information, set the log_min_duration_statement parameter in postgresql.conf. SQL statements that took longer than the value set in this parameter will be output in a message with the execution time.
| Parameter |
Description and values to set |
| log_min_duration_statement |
Specify one of the following
- 0 or more: Outputs the SQL statements and execution times that took longer than the set value (if 0 is set, outputs all SQL statements and execution times)
- -1: Do not output SQL statements and execution times
|
For example, to output SQL that took more than 3 seconds to execute, set log_min_duration_statement= 3s.
Keep in mind that the shorter the time you set, the more messages will be output. A large amount of server log message output may cause the performance of the entire system to deteriorate, so be careful with the value you set.
Example
The following is a sample output to the server log.
00000: 2023-11-24 17:06:30 EST [7652]: [2-1] user = ,db = ,remote = app = LOG: database system is ready to accept connections
00000: 2023-11-24 17:06:30 EST [2536]: [1-1] user = db = remote = app = LOG: autovacuum launcher, started
00000: 2023-11-34 17:06:34 EST [4460]: [1-1] user = postgres_dba,db = postgres,remote = 127.0.0.1(3215) app = psql
LOG: duration: 4781.000 ms statement: SELECT * FROM stock;A
ASQL that took a long time and the time it took is recorded as a message, along with the standard log.
In addition, by using the module auto_explain, it is also possible to output the execution plan of the SQL statement that took longer than the set value to the server log. For more information on auto_explain, refer to PostgreSQL documentation > Appendixes > Additional supplied modules > auto_explain.
How to investigate the cause
Now that we have detected slow SQL statements, it's time to investigate their cause. You can display SQL execution plans by adding EXPLAIN command to the beginning of the detected SQL statement. Refer to this execution plan to identify the cause.
Displaying the execution plan with the EXPLAIN command
The EXPLAIN command shows you how referenced tables are scanned in a SQL statement and how the fetched rows are joined.
If you execute it only with EXPLAIN, the estimates for the cost, the number of rows, and the input size for executing the SQL statement are displayed. They are estimated values, since the SQL statement is not actually executed.
EXPLAIN stock.prod_id, order_total FROM stock, orders WHERE stock.prod_id=orders.prod_id AND order_total>1000;
QUERY PLAN
----------------------------------------------------------------------------------------------------------
Nested LoopA (cost=0.00..857.16 row=4 width=16)1
-> Seq ScanB on orders (cost=0.00..840.00 rows=4 width=16)1
Filter: (order_total > 1000)
-> Index Only ScanC using stock_pkye on stock (cost=0.00..4.28 rows=1 width=4)1
Index Cond: (prod_id = orders.prod_id)
AThe tables will be joined by Nested Loop (table join by a double loop)
BThe table data will be retrieved via Seq Scan (all rows of the table will be retrieved in order, from the top)
CThe table data will be retrieved via Index Only Scan (only the index will be accessed, not the table)
1 Cost to return the first row (left side) and cost to return all rows (right side) (this does not include costs for communication and client terminal display), number of rows of inferred query results, and estimated input size
How to display and confirm the actual values measured with the ANALYZE option
To display measured values in addition to the estimated values, you can add the ANALYZE option to the EXPLAIN command. With the actual value obtained by executing the SQL statement, you can check whether the estimated value is close to the measured value.
Since the SQL statement will be actually executed, when you execute INSERT statement or DELETE statement, please specify as follows so as not to affect the data.
BEGIN;
EXPLAIN ANALYZE ...;
ROLLBACK;
EXPLAIN ANALYZE SELECT * FROM stock WHERE qty > 100;
QUERY PLAN
---------------------------------------------------------------------------------------------------
Seq ScanA on stock (cost=0.00..1685.50 rows=789 width=97)(actual time=0.012..105.338 rows=78671 loops=1))B
Filter: (qty < 100)
Rows Removed by Filter: 21329
Planning time: 0.118 ms
Execution time: 196.998 ms
AHow the referenced tables are scanned and how the fetched rows are joined in the SQL. Seq Scan means that no index is used and all rows are examined. For tables with a large number of rows, adding indexes can improve performance, in which case Index Scan is displayed
BPostgreSQL estimates the number of rows to be processed based on the value of the statistics. The significant gap between the estimated value (789) and the measured value (78671) indicates that the statistics are outdated. It is recommended to manually update the statistics (execute the ANALYZE command).
Summary
This article has given an overview of SQL tuning and explained how to find slow SQL statements and investigate their causes. This information will help you identify what kind of tuning is required to the system to achieve an even more cost-effective database system.