Your business will suffer if your database system fails, or worse, if it stops. Countermeasures and measures against failure must be planned in advance. Database system monitoring plays an essential role in risk management.
Understanding the stable state of your database system, monitoring the system to maintain stability, and planning thoroughly are key to reacting quickly in case an error occurs. Periodically collecting and storing database system information allows you to detect early signs of errors or to identify their cause.
This article covers what and how to monitor in PostgreSQL database systems. This article assumes you are running Linux.
What is database system monitoring?
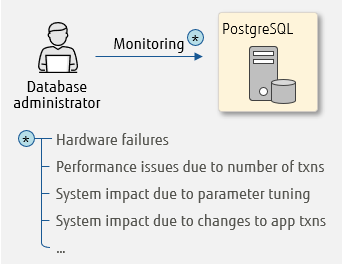
Database system monitoring is essential to maintaining stable operation. It is critical to understand affecting factors in order to take appropriate actions when an abnormality is detected.
Factors that affect database systems include:
- unexpected increase in the volume of processing or data
- parameter changes during system repairs
- changes in application processes
- hardware failures such as disk errors
Performance may deteriorate or the database system may even stop as a result.
Database system monitoring
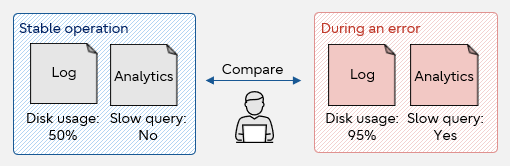
When you detect an anomaly in a database, it is often difficult to determine the cause. That is why it is vital to regularly collect and save various statistical information and logs (syslog, server log), so that you are aware of the values recorded during normal operation. These values give you a baseline against which you can compare values during an error to help you identify the cause. It is also helpful to detect early signs of an upcoming abnormality.
Comparison and analysis
Database system monitoring metrics
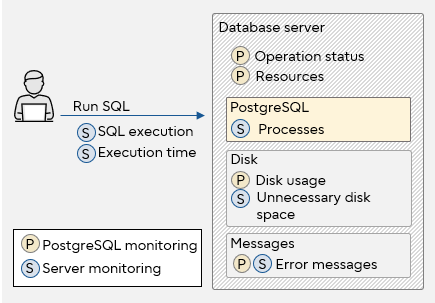
Each of the factors that affect system performance described in the section above occurs as an event and calls for your attention. This section describes what data to monitor. Database system monitoring can be broadly separated between server monitoring and PostgreSQL monitoring.
Server monitoring involves ensuring that the servers running PostgreSQL are operating normally, OS resources are sufficient, no error messages are output to syslog, and no problems are found in disk usage.
In comparison, PostgreSQL monitoring involves checking that PostgreSQL processes are running, SQLs are executed, there are no slow SQLs, unnecessary space is under control, and no error messages are output to the server log.
Monitoring target
The main metrics for server monitoring and PostgreSQL monitoring are listed below.
| Classification |
Metrics |
| Server monitoring |
Server life check |
Server OS response |
| OS resources |
CPU usage |
| Memory usage |
| I/O busy rate |
| Network bandwidth usage |
| Messages |
syslog (system process and hardware messages)*1 |
| Disk capacity |
Usage rate, used capacity, free capacity |
| PostgreSQL monitoring |
PostgreSQL life check |
PostgreSQL process |
| Whether search and update queries can be executed normally |
| Messages |
Server log |
| Disk capacity |
Disk space used by databases and indexes |
| Performance |
Slow SQL |
| Transactions that have been pending for a long time |
| SQL with long lock wait time |
| Replication delay (when replication setup is used) |
| Performance (fragmentation) |
Unnecessary space (free space created by insertion and deletion of data) |
| Index dispersion (whether the order of indexes and the order of tables are the same) |
*1: When SNMP (Simple Network Management Protocol) messages are output to syslog
Database system monitoring types
In the previous section, we explored what to monitor. Now, let's take a look at how to monitor database systems.
This section describes monitoring types and frequency.
Monitoring types
Monitoring types are separated into four categories, which are explained below.
- Life check monitoring, status monitoring
Check that servers are responding, PostgreSQL processes are running normally, and SQLs can be executed. This type of monitoring allows you to detect failures at an early stage, which will minimize your system downtime.
Use OS ping for server life check. For PostgreSQL life check, you can use the OS ps command, or PostgreSQL's pg_isready. To execute SQLs, use simple queries such as SELECT 1.
Additionally, you can look into the status of OS resources like CPU and memory. Monitoring resource status support early detection and resolution of failure. Use OS sar and vmstat to monitor the status of OS resource.
- Message monitoring
PostgreSQL outputs information and error messages to the server log, using syslog to record system process and hardware messages. You can detect errors by monitoring these logs and also analyze the cause of errors in order to take appropriate action.
Each message has one of the following levels, indicating the importance of the content:
- DEBUG [1-5]
- INFO
- NOTICE
- WARNING
- ERROR
- LOG
- FATAL
- PANIC
When an error occurs in PostgreSQL, "ERROR", "FATAL", or "PANIC" is assigned. By prioritizing these three types of messages, you can detect and address the error immediately. Note that the levels of PostgreSQL information and error messages are converted when they are output to syslog; ERROR becomes WARNING, FATAL is converted to ERR, and PANIC is changed to CRIT. Therefore, when you refer to syslog messages, remember to look for the latter values.
- Capacity monitoring
The capacity of database cluster area (PGDATA), TABLESPACE area, and archive WAL (Write-Ahead Log) needs to be monitored because if these become insufficient, the database cannot be updated or PostgreSQL is forced to shut down, which seriously hinders operation. By monitoring the disk usage rate and free space, you can detect signs of insufficient space. Make required changes such as adding disks before capacity becomes insufficient.
To perform capacity monitoring, use the OS commands ls and du, PostgreSQL's pg_database_size and pg_statsinfo.
- Performance monitoring
Performance monitoring includes checking slow SQL statements, SQLs waiting for locks to be released (those pending for a long time), cache hit rate, index usage rate, and OS resource status. By monitoring these together, you can determine the tuning points and quickly respond to problems.
Tuning can be separated into system tuning and SQL tuning.
- System tuning optimizes your system or program, by adjusting hardware or changing values in configuration files such as postgresql.conf, for example.
- SQL tuning ensures the best SQL performance by reviewing the SQL statements (table design, SQL design, etc.). Additionally, monitor and respond to unnecessary space and dispersed indexes to potentially improve performance.
To perform monitoring, use PostgreSQL statistical information view and server log. You can also utilize pg_statsinfo or pgBadger.
Monitoring intervals and thresholds
Let's say you have decided on the monitoring metrics and types explained in "Monitoring metrics" and "Monitoring types". Next, you need to decide the frequency of monitoring and threshold values to determine what values should be regarded as abnormal.
Monitoring intervals
Monitoring intervals should be determined taking into consideration system requirements such as SLA (Service Level Agreement) and monitoring load. On one hand, high-frequency monitoring facilitates early detection of abnormalities, but on the other hand, it increases the amount of data accumulated, demanding more disk resources.
Frequent monitoring can also affect the network bandwidth where network connection is required for monitoring. Therefore, it is important to set monitoring intervals according to the target and purpose of monitoring.
| Monitoring type |
Monitoring interval recommendations |
| Life check monitoring, status monitoring |
Monitor in units of seconds to minimize system downtime.
In the event of a failure, the switch to standby server must be done immediately, so frequent monitoring is recommended. |
| Message monitoring |
Monitor in units of minutes to obtain data over a relevant period. More data is required in addition to the statistics during an error.
A large amount of data is collected and saved to identify the cause of a problem or to isolate issues. If these types of monitoring are performed in intervals of seconds, disk capacity may be affected. |
| Capacity monitoring |
| Performance monitoring |
Thresholds
The definition or judgement of an abnormal state varies on each system. Therefore, threshold values need to be set, so that systems can determine abnormality. Factors including the state of stable operation, potential changes in the system, and response time in the event of an abnormality need to be considered when defining threshold values.
In other words, threshold values require thorough consideration of the target and purpose of monitoring.
For example, if an error is detected only when free disk space reaches 1%, the system may stop before you can set up additional disk space. Set a threshold value with a margin such as raise an alarm when the free disk space falls below 20%, so that you can address the issue without impacting operation.
Monitoring tools
For monitoring, a shell script or SQL shell script needs to be created. Alternatively, monitoring tools mentioned below are available.
PostgreSQL does not have native features for monitoring, although a feature to collect data for database monitoring is provided.
| OSS monitoring tool |
Overview |
Notification feature |
| pg_statsinfo |
Collects and saves statistical data and OS resource data in a chronological order. Offers the following:
- statistical data collection
- simple report
- alert
|
Yes |
| pgBadger |
Outputs a log file analysis and statistics report. |
None |
| Zabbix |
Centrally monitors servers, networks, and applications. Offers the following features required for integrated monitoring:
- monitoring
- failure detection
- notification
|
Yes |
| pg_monz (template) |
| Hinemos |
Manages operations of multiple computers with an image in a single computer. Offers features to perform the following:
- status monitoring
- job management
- performance management
- environment construction
- data collection and accumulation
|
Yes |
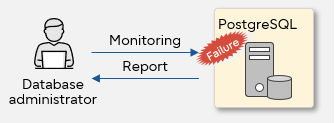
Now we know how to detect an error through monitoring. On top of what has been discussed in this article, a reporting mechanism to notify the error to the administrator need to be implemented.
Reporting
The metrics and types for monitoring PostgreSQL database systems were outlined in this article. By monitoring database systems, anomalies and their signs can be detected and addressed in a timely manner. Early detection and resolution will prevent systems from stopping, and responsive plans will protect your business with the highly available system in your hand.